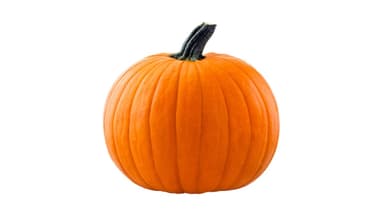
Pie Pumpkin
Updated October 31, 2026
Velocity index
10/100
Recently sold
500+
Store coverage
2 stores
Price (median)
$2.50
Velocity trend (recently-sold trajectory)
September 25, 2026 – November 9, 2026 · hover for the recently-sold bracket per snapshot
Show the data table (4 snapshots)
| Snapshot date | Recently sold (items) | Stores selling it |
|---|---|---|
| October 28, 2026 | 100+ recently sold | 1 |
| October 29, 2026 | 400+ recently sold | 2 |
| October 30, 2026 | 400+ recently sold | 1 |
| October 31, 2026 | 500+ recently sold | 1 |
Based on a panel of US convenience & grocery stores on a delivery platform — a delivery-channel sample, not national retail sales.Limited sample — interpret with caution.
How it compares in Produce

Banana Bunch
Banana Bunch · 29,500+ recently sold · 3 stores

Gala Apples
Gala Apples · 21,600+ recently sold · 5 stores

Banana (each)
Banana · 75,000+ recently sold · 9 stores
Mango (each)
Mango · 19,000+ recently sold · 3 stores

Strawberries
Strawberries · 22,200+ recently sold · 9 stores
Red Onions
Red Onions · 24,500+ recently sold · 3 stores
More produce by velocity
- 1.Regular Pumpkin (each)13/100
- 2.Organic Strawberries30/100
- 3.Mandarins31/100
- 4.Granny Smith Apple (each)35/100
- 5.Medium Sweet Potato (each)26/100
- 6.Zespri Organic New Zealand Sungold Golden Kiwifruit21/100
- 7.Cranberries14/100
- 8.Lucy Rose Apples12/100
See the full ranking: trending produce.
Related categories in Fresh
Frequently asked questions
- Is Pie Pumpkin selling well?
- Pie Pumpkin has a velocity index of 10/100 in Produce and is currently steady. It was 500+ recently sold across 2 stores in the panel. Based on a panel of US convenience & grocery stores on a delivery platform — a delivery-channel sample, not national retail sales.
- Is Pie Pumpkin trending up or down?
- Over the tracking window, Pie Pumpkin is steady (holding its velocity).